Fluentdの出力結果をStatHatで可視化する
2013.03.17 fluentd stathat logging visualization
Fluentdで取得した情報を可視化したいとき、fluent-plugin-growthforecastを使ってGrowthForecastにグラフを作る方法がよく知られている。GrowthForecastはインストール後すぐに使い始められるお手軽ツールなんだけど、それすら面倒くさい、自前で環境を作るのが面倒、というときにはStatHatを使うと簡単に可視化を実現できるという話。
StatHatはシンプルなインターフェースで必要十分な機能があり、しかも無料で使えるというサービス。HTTPでデータを登録するだけできれいなグラフが簡単に生成できるので、幅広い用途で利用できる。
以降、FluentdとStatHatを組み合わせて利用するための設定を説明する。
作業
StatHat
StathatのSign upにアクセスしてメールアドレスを登録し、折り返し届くメール内のURLからパスワードを登録すればすぐ使い始められる。グラフを作るための下準備は不要。まずは、curl を使って直接 POST してみる。
curl -d "email=登録時のメールアドレス&stat=body temperature&value=36.8" http://api.stathat.com/ez
すると、メールアドレス宛にグラフの追加が通知され、画面から確認できるようになる。
(メールアドレスに+みたいなURLエンコードが必要な文字を含んでる場合は、 --data-urlencode を使って一つずつパラメータを指定すればいい)
APIを利用するために必要となるキーは、初期状態だと登録時のメールアドレスになっている。これは設定画面から変更可能。タイムゾーンも修正できるので住んでいる地域に変更しておいた方がいい。
Fluentd
Fluentd から StatHat を利用するためにプラギン作ったので、これを利用する。
fluent-gem install fluent-plugin-stathat
たとえば、よくある「HTTP ステータスコードのカウント」の場合、以下のような設定をすればいい。
<source>
  type tail
  format apache
  path /var/log/httpd/access_log
  tag apache.access
</source>
<match apache.access>
  type datacounter
  unit minute
  tag stathut.httpstatus
  count_key code
  pattern1 2xx ^2\d\d$
  pattern2 3xx ^3\d\d$
  pattern3 4xx ^4\d\d$
  pattern4 5xx ^5\d\d$
</match>
<match stathut.httpstatus>
  type copy
  <store>
    type  stathat
    stat 2xx
    ezkey [email protected]
    count apache.access_200_count
  </store>
  <store>
    type  stathat
    stat 3xx
    ezkey [email protected]
    count apache.access_3xx_count
  </store>
  <store>
    type  stathat
    stat 4xx
    ezkey [email protected]
    count apache.access_4xx_count
  </store>
  <store>
    type  stathat
    stat 5xx
    ezkey [email protected]
    count apache.access_5xx_count
  </store>
</match>
これで、こういったグラフが作れる。
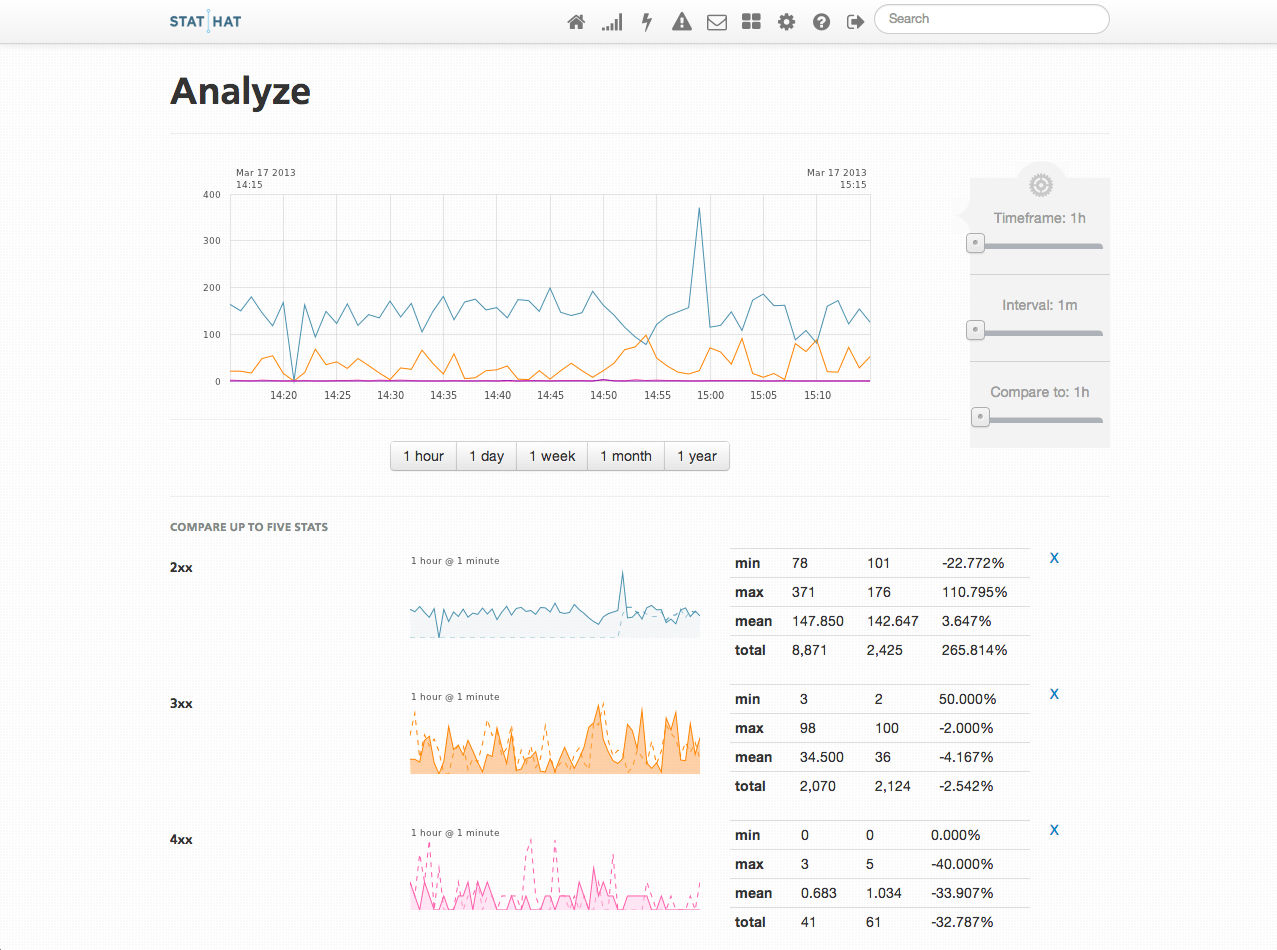
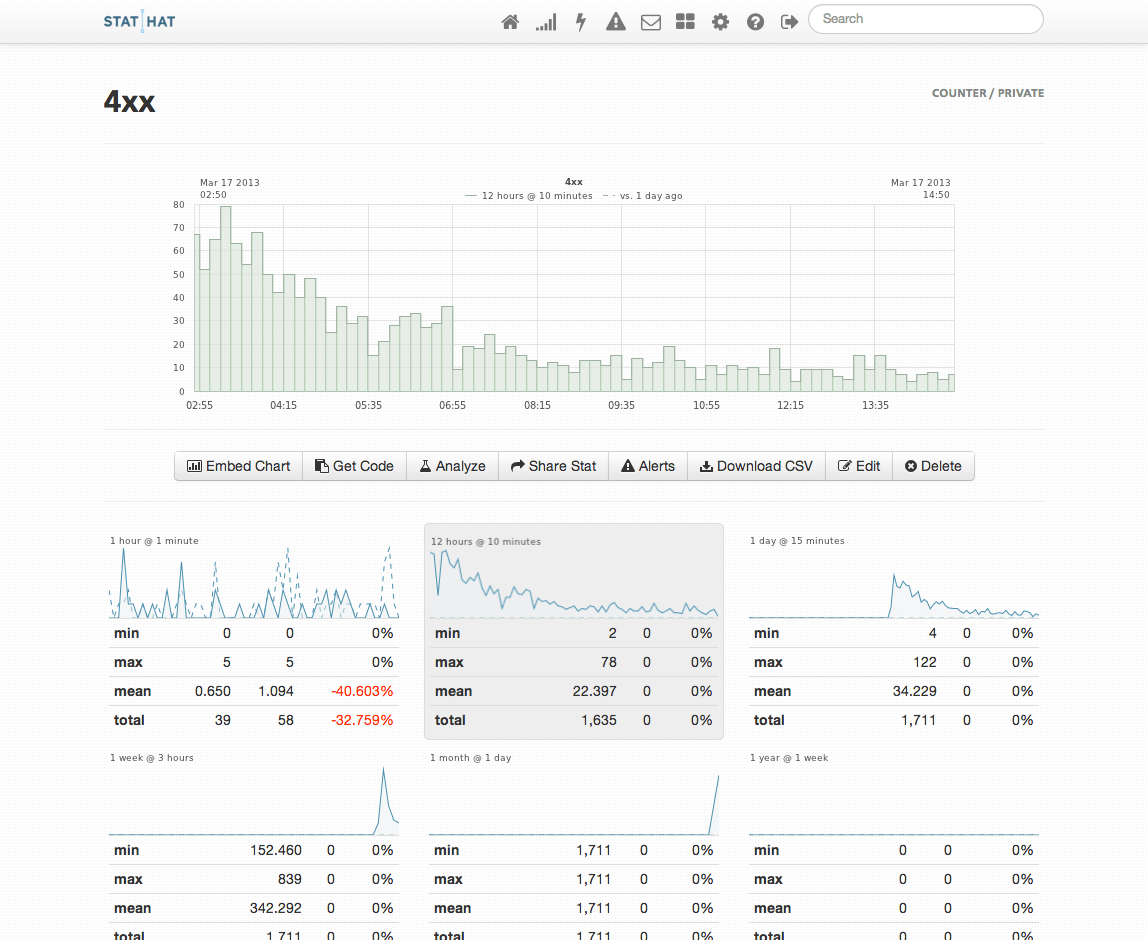
まとめ
StatHat 便利。